Welcome to our online trading wolrd!
Our purpose is to help you how to start online trading like forex, commodities, options successfully
Now, let's get started our journey with the article called: Using ''Bollinger Bands'' Indicator in Online Trading
Bollinger Bands are a technical analysis indicator that excels at predicting the future behavior of the price chart.
What are Bollinger Bands?
Bollinger Bands is a moving average and two accompanyings bands. The latter are one standard deviation away from the moving average. In a nutshell, the higher the price volatility, the further away the bands are from the moving average.
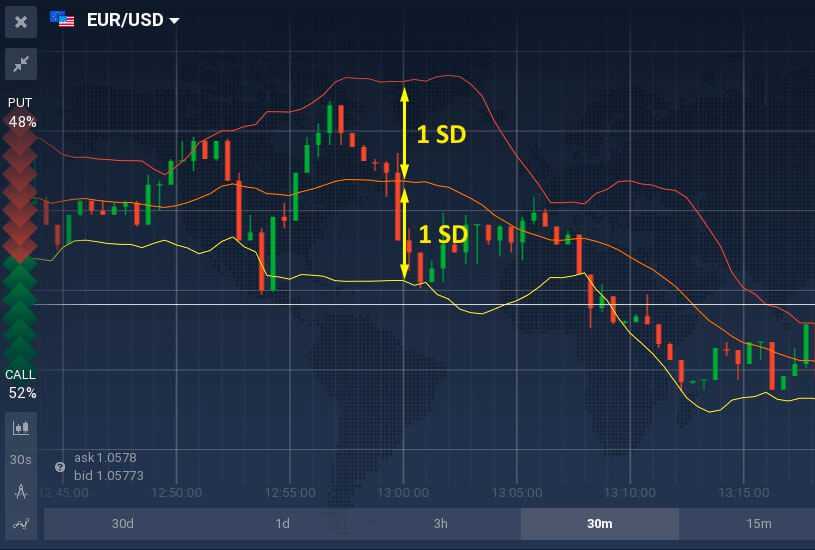
In other words, the bigger the standard deviation the wider the price range of an underlying asset for the given period of time. Measuring how far the price can deviate from its average value is helpful when trying to predict future price movements.
How it works?
As noted above, the indicator consists of three lines: one exponential moving average (EMA) and two price channels above and below it. Price channels widen when the volatility is high and contract during the flat market.
For investors volatility is as important as trend direction and trend strength. Volatile markets provide additional trading opportunities.
If you want to use Bollinger Bands in trading, it’s important to understand they are based on one simple idea: when the price levels rise/drop too much they are supposed to bounce back. Periods of low volatility are usually followed by serious market movements, which can also be predicted with the help of Bollinger Bands. All of the above can be used by traders to determine optimal entry points.
How to set up?
- Click on the “Indicators” button in the bottom left corner of the screen and pick “Bollinger Bands” from the list of available indicators.
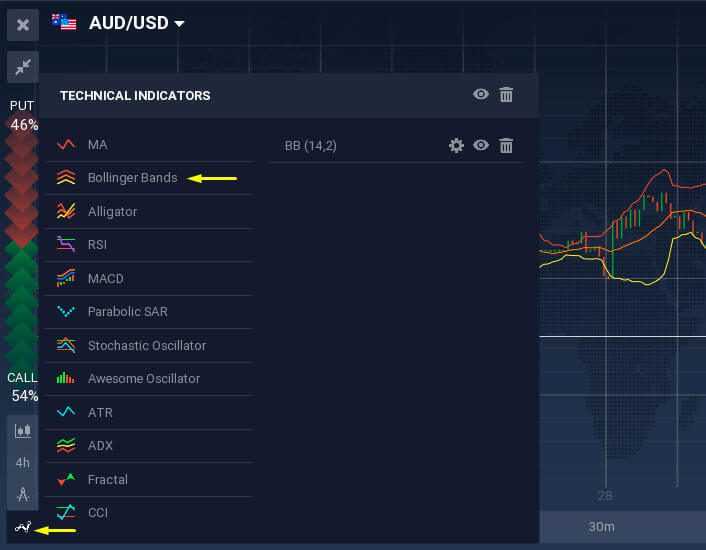
2. Then click “Apply” if you prefer working with recommended settings. Otherwise, go to the “Set up & apply” tab and get an opportunity to adjust the period and the standard deviation.

3. The indicator is ready to use!
How to use in online trading?
In order to use Bollinger Bands effectively in day trading, it’s essential to understand basic characteristics of price volatility and its applications in trading.
As a rule, periods of low volatility are generally intermingled with high volatility periods. In the downtrend, the price usually fluctuates between the lower band and the average line. In the uptrend, on the contrary, the price lies in the corridor between the upper band and the middle line.
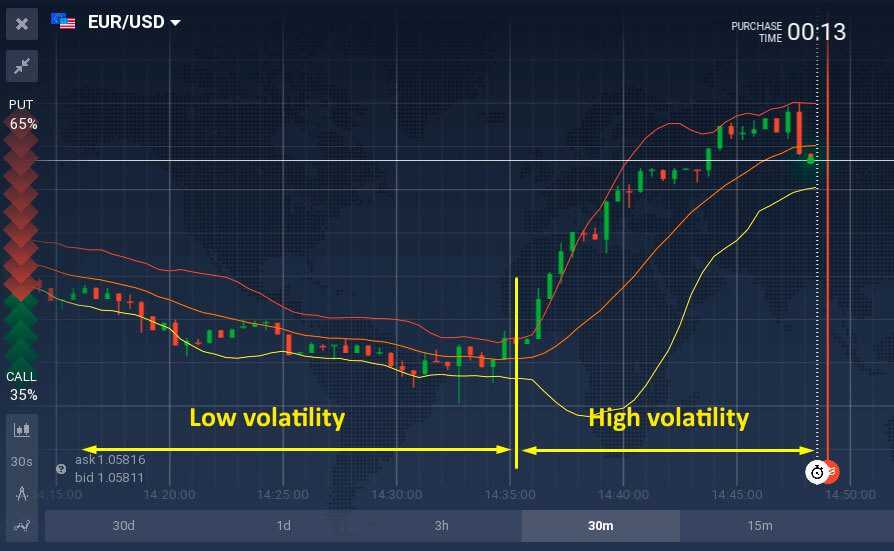
The longer the market stays still the higher are the chances for an upcoming volatility boost. Bollinger Bands are good at pinpointing these moments. Using this indicator the trader is able to predict future volatility fluctuations and determine overbought/oversold positions, opening deals at the most expedient moment. However, it is also important to remember that no indicator is 100% accurate. All indicators are capable of providing false signals.
When the asset leaves the “normal” price range the majority of risk-averse traders stop opening new deals and wait for the market to stabilize once again.
Special features
The squeeze
The situation when the price bands come closer together is called the squeeze. Suchlike periods indicate low current volatility and the potential for high volatility in the near future. However, the indicator doesn’t provide the trader with the information on a particular moment in time when volatility is supposed to increase. Traders remain mostly inactive during the squeeze.
Breakouts
Approximately 90% of price action takes place between the price bands. The events that take place in the remaining 10% of the time are called breakouts. A breakout is an event during which price action leaves the “normal” price range. They should not be used as trading signals as they do not provide any information on future trend strength and direction.
Combine and conquer
Bollinger Bands are good at showing current volatility and sometimes predicting upcoming market fluctuations but are not a universal trading tool. According to Mr. Bollinger himself, this indicator should be combined with other indicators for maximum predictive potential and effectiveness.
Conclusion
Bollinger Bands are an indicator worth learning and using in real-life trading. Not only it is useful but can also provide timely buy or sell signals, while the majority of market participants are still unaware of the future trend direction.
Try For FREE
NOTE: This article is not an investment advice. Any references to historical price movements or levels is informational and based on external analysis and we do not warranty that any such movements or levels are likely to reoccur in the future.
In accordance with European Securities and Markets Authority’s (ESMA) requirements, binary and digital options trading is only available to clients categorized as professional clients.
In accordance with European Securities and Markets Authority’s (ESMA) requirements, binary and digital options trading is only available to clients categorized as professional clients.
GENERAL RISK WARNING
CFDs are complex instruments and come with a high risk of losing money rapidly due to leverage.
77% of retail investor accounts lose money when trading CFDs with this provider.
You should consider whether you understand how CFDs work and whether you can afford to take the high risk of losing your money.
77% of retail investor accounts lose money when trading CFDs with this provider.
You should consider whether you understand how CFDs work and whether you can afford to take the high risk of losing your money.
Comments
Post a Comment